Prometheus 开始
Prometheus + Grafana 快速开始,监控主机的 CPU, GPU, MEM, IO 等状态。
前提
客户端
Node Exporter
用于采集 UNIX 内核主机的数据,这里下载并解压:
wget https://github.com/prometheus/node_exporter/releases/download/v1.1.2/node_exporter-1.1.2.linux-amd64.tar.gz
tar xvfz node_exporter-1.1.2.linux-amd64.tar.gz
cd node_exporter-1.1.2.linux-amd64
nohup ./node_exporter &
查看数据:
$ curl http://localhost:9100/metrics
# HELP go_gc_duration_seconds A summary of the pause duration of garbage collection cycles.
# TYPE go_gc_duration_seconds summary
go_gc_duration_seconds{quantile="0"} 0
go_gc_duration_seconds{quantile="0.25"} 0
go_gc_duration_seconds{quantile="0.5"} 0
...
DCGM Exporter
用于采集 NVIDIA GPU 的数据,以 Docker 镜像运行:
docker run -d --restart=always --gpus all -p 9400:9400 nvidia/dcgm-exporter
查看数据:
$ curl localhost:9400/metrics
# HELP DCGM_FI_DEV_SM_CLOCK SM clock frequency (in MHz).
# TYPE DCGM_FI_DEV_SM_CLOCK gauge
# HELP DCGM_FI_DEV_MEM_CLOCK Memory clock frequency (in MHz).
# TYPE DCGM_FI_DEV_MEM_CLOCK gauge
# HELP DCGM_FI_DEV_MEMORY_TEMP Memory temperature (in C).
...
服务器
Prometheus
配置 ~/prometheus.yml:
global:
  scrape_interval: 15s

scrape_configs:
# Node Exporter
- job_name: node
  static_configs:
  - targets: ['192.167.200.91:9100']
# DCGM Exporter
- job_name: dcgm
  static_configs:
  - targets: ['192.167.200.91:9400']
运行 Docker 镜像:
docker run -d --restart=always \
-p 9090:9090 \
-v ~/prometheus.yml:/etc/prometheus/prometheus.yml \
prom/prometheus
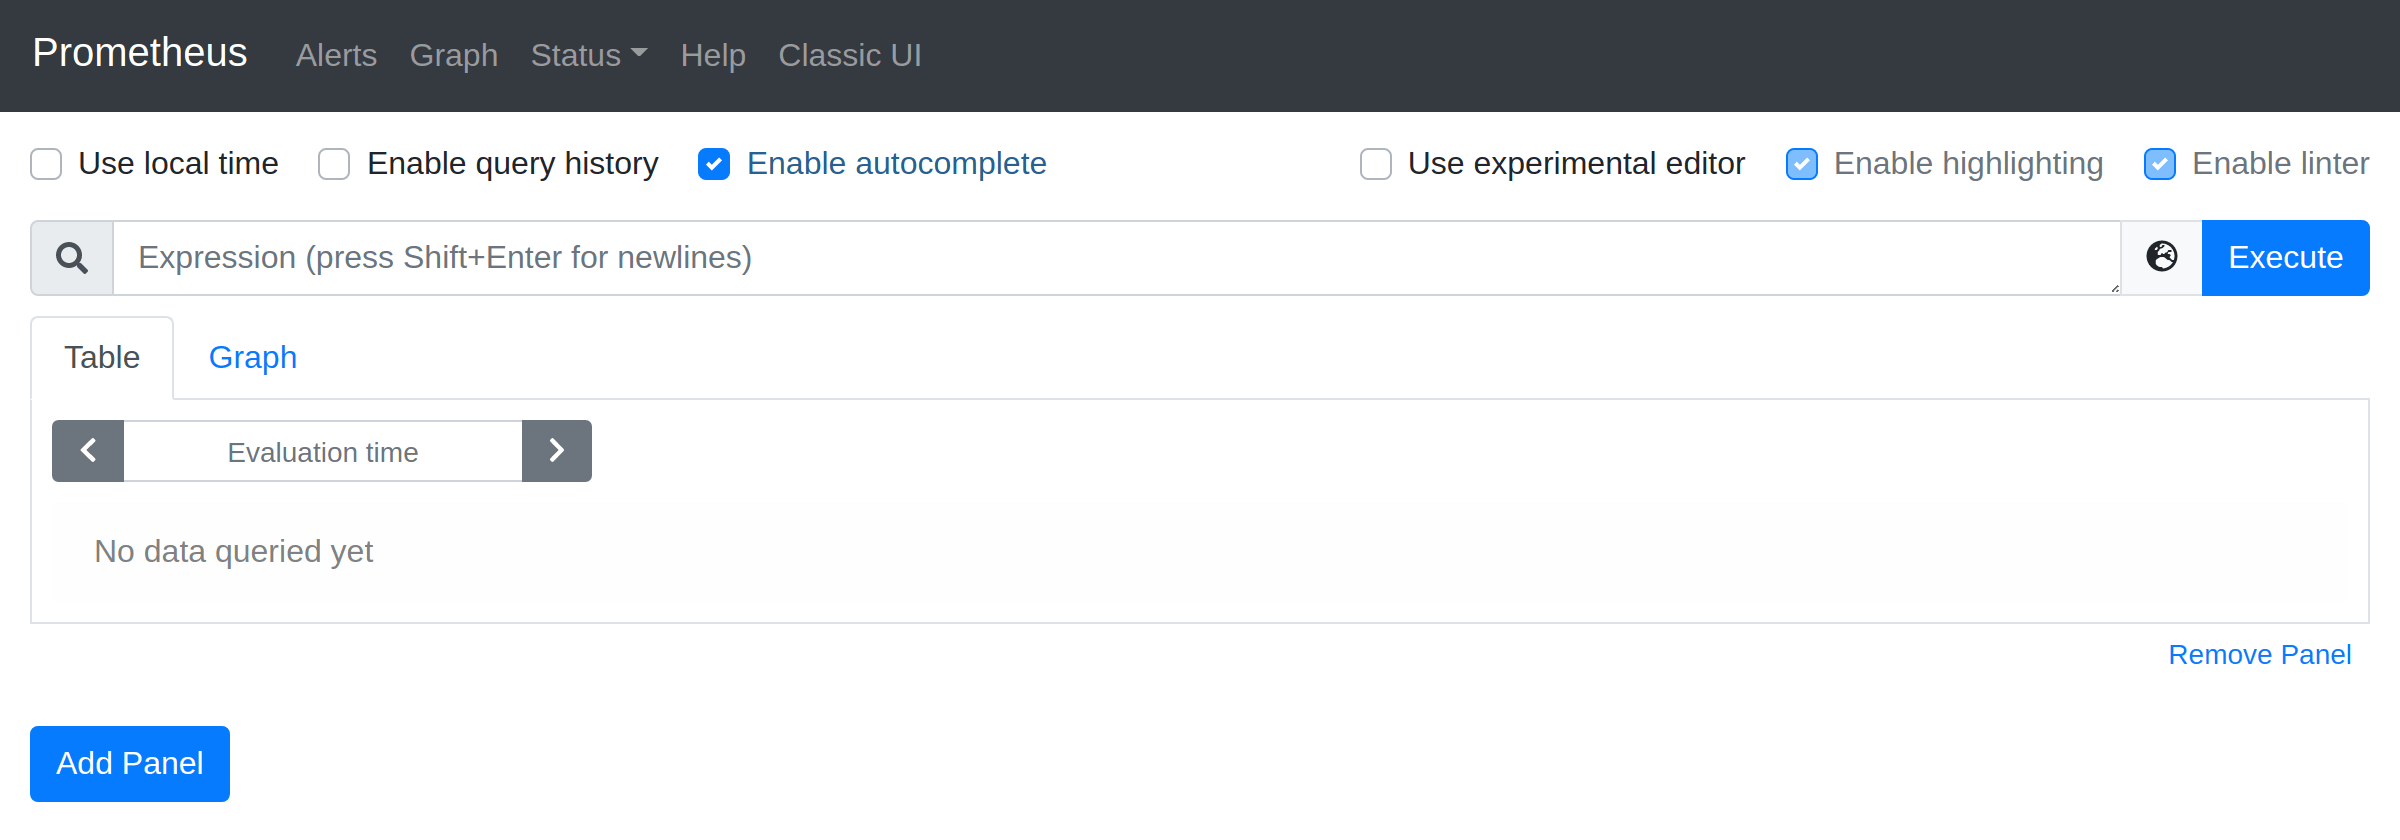
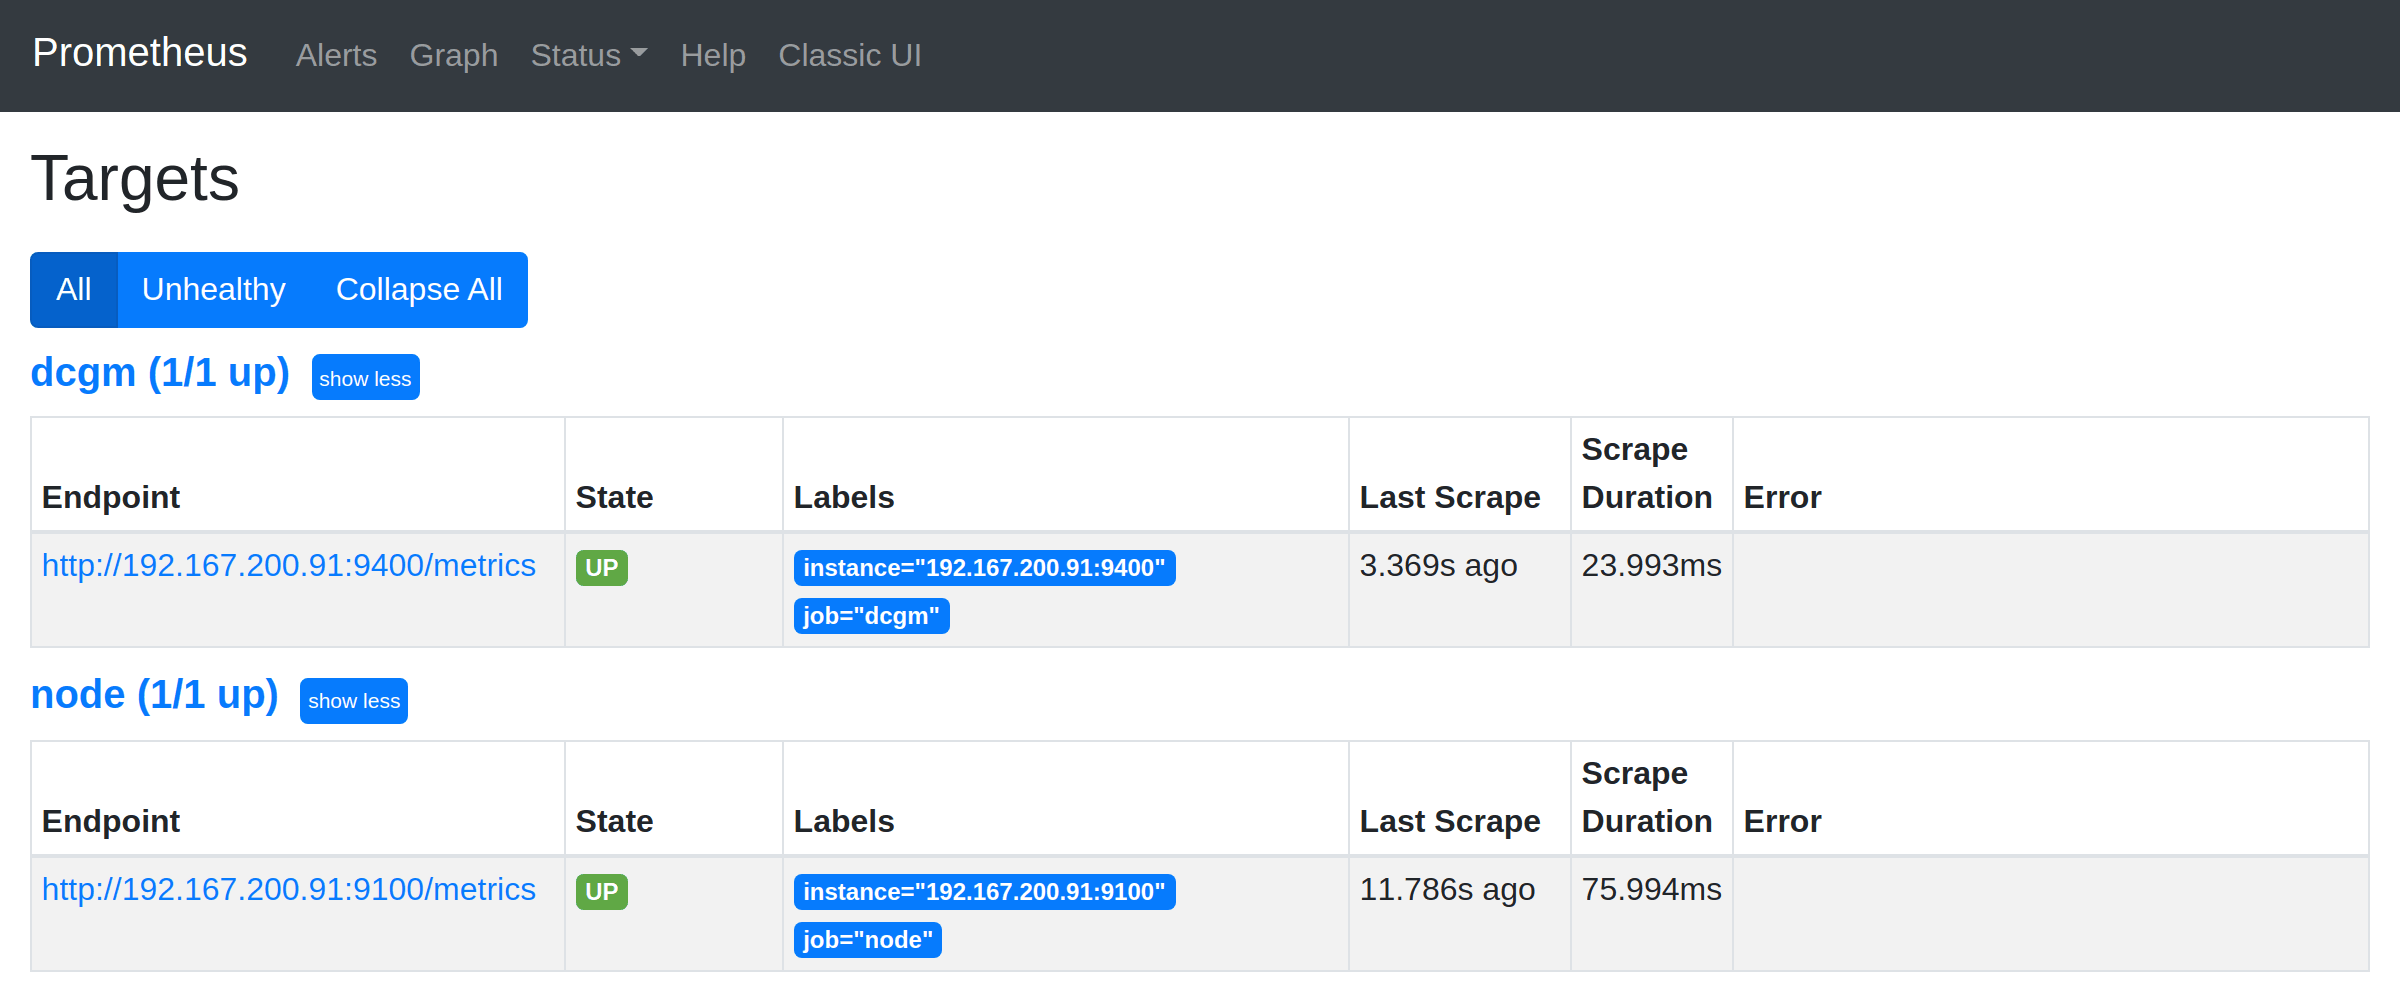
访问 http://localhost:9090/targets :
Grafana
运行 Docker 镜像:
docker run -d --restart=always -p 3000:3000 grafana/grafana

以 admin/admin 登录。
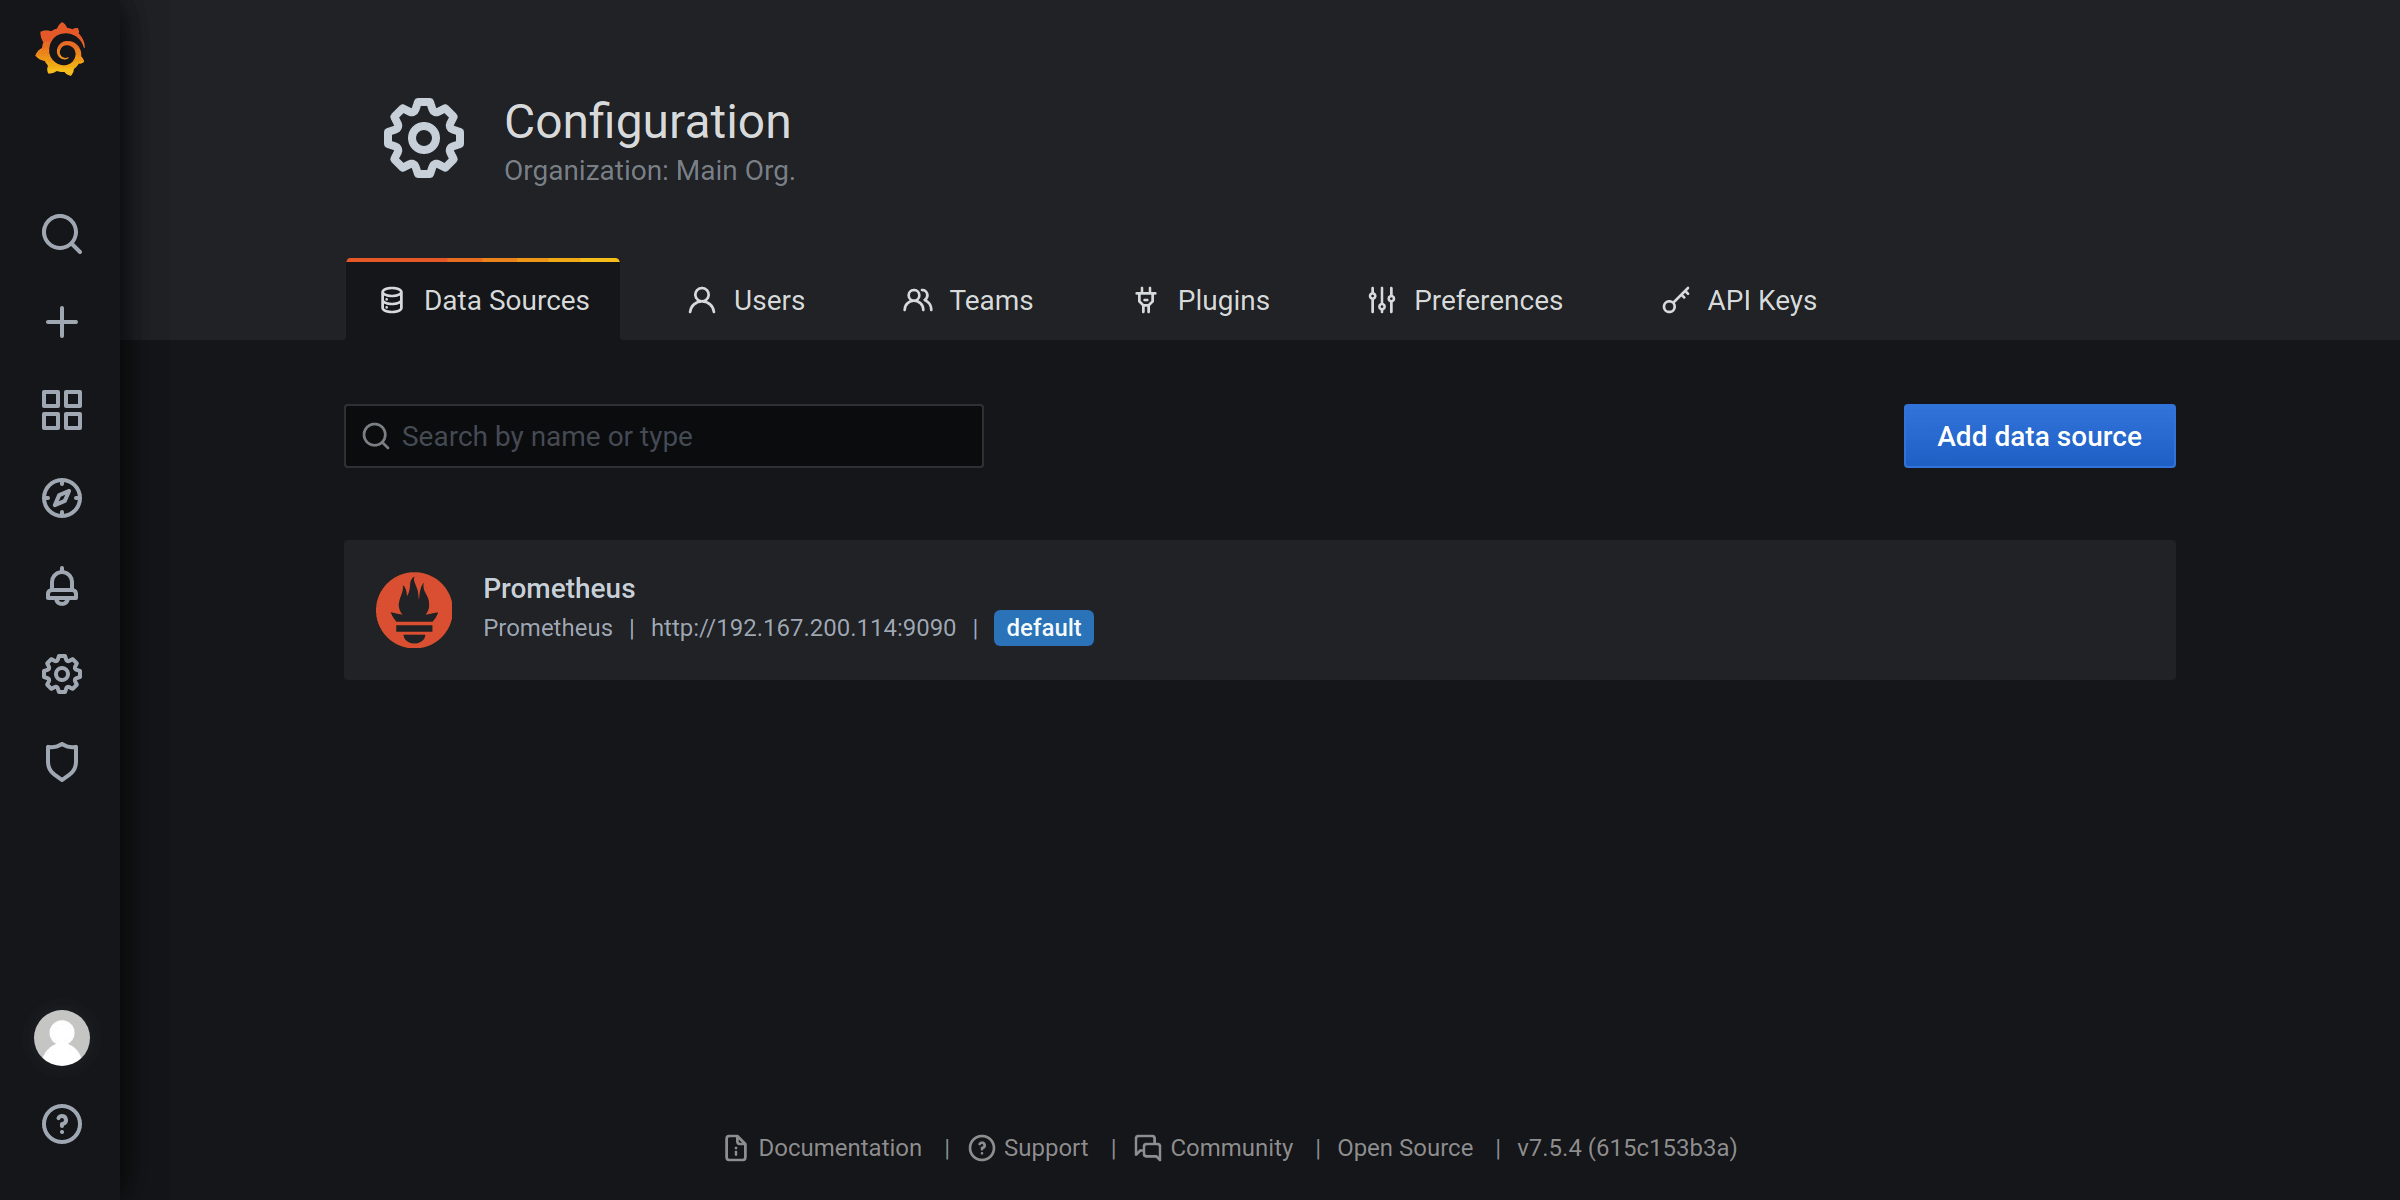
新增数据源

新增 Prometheus:
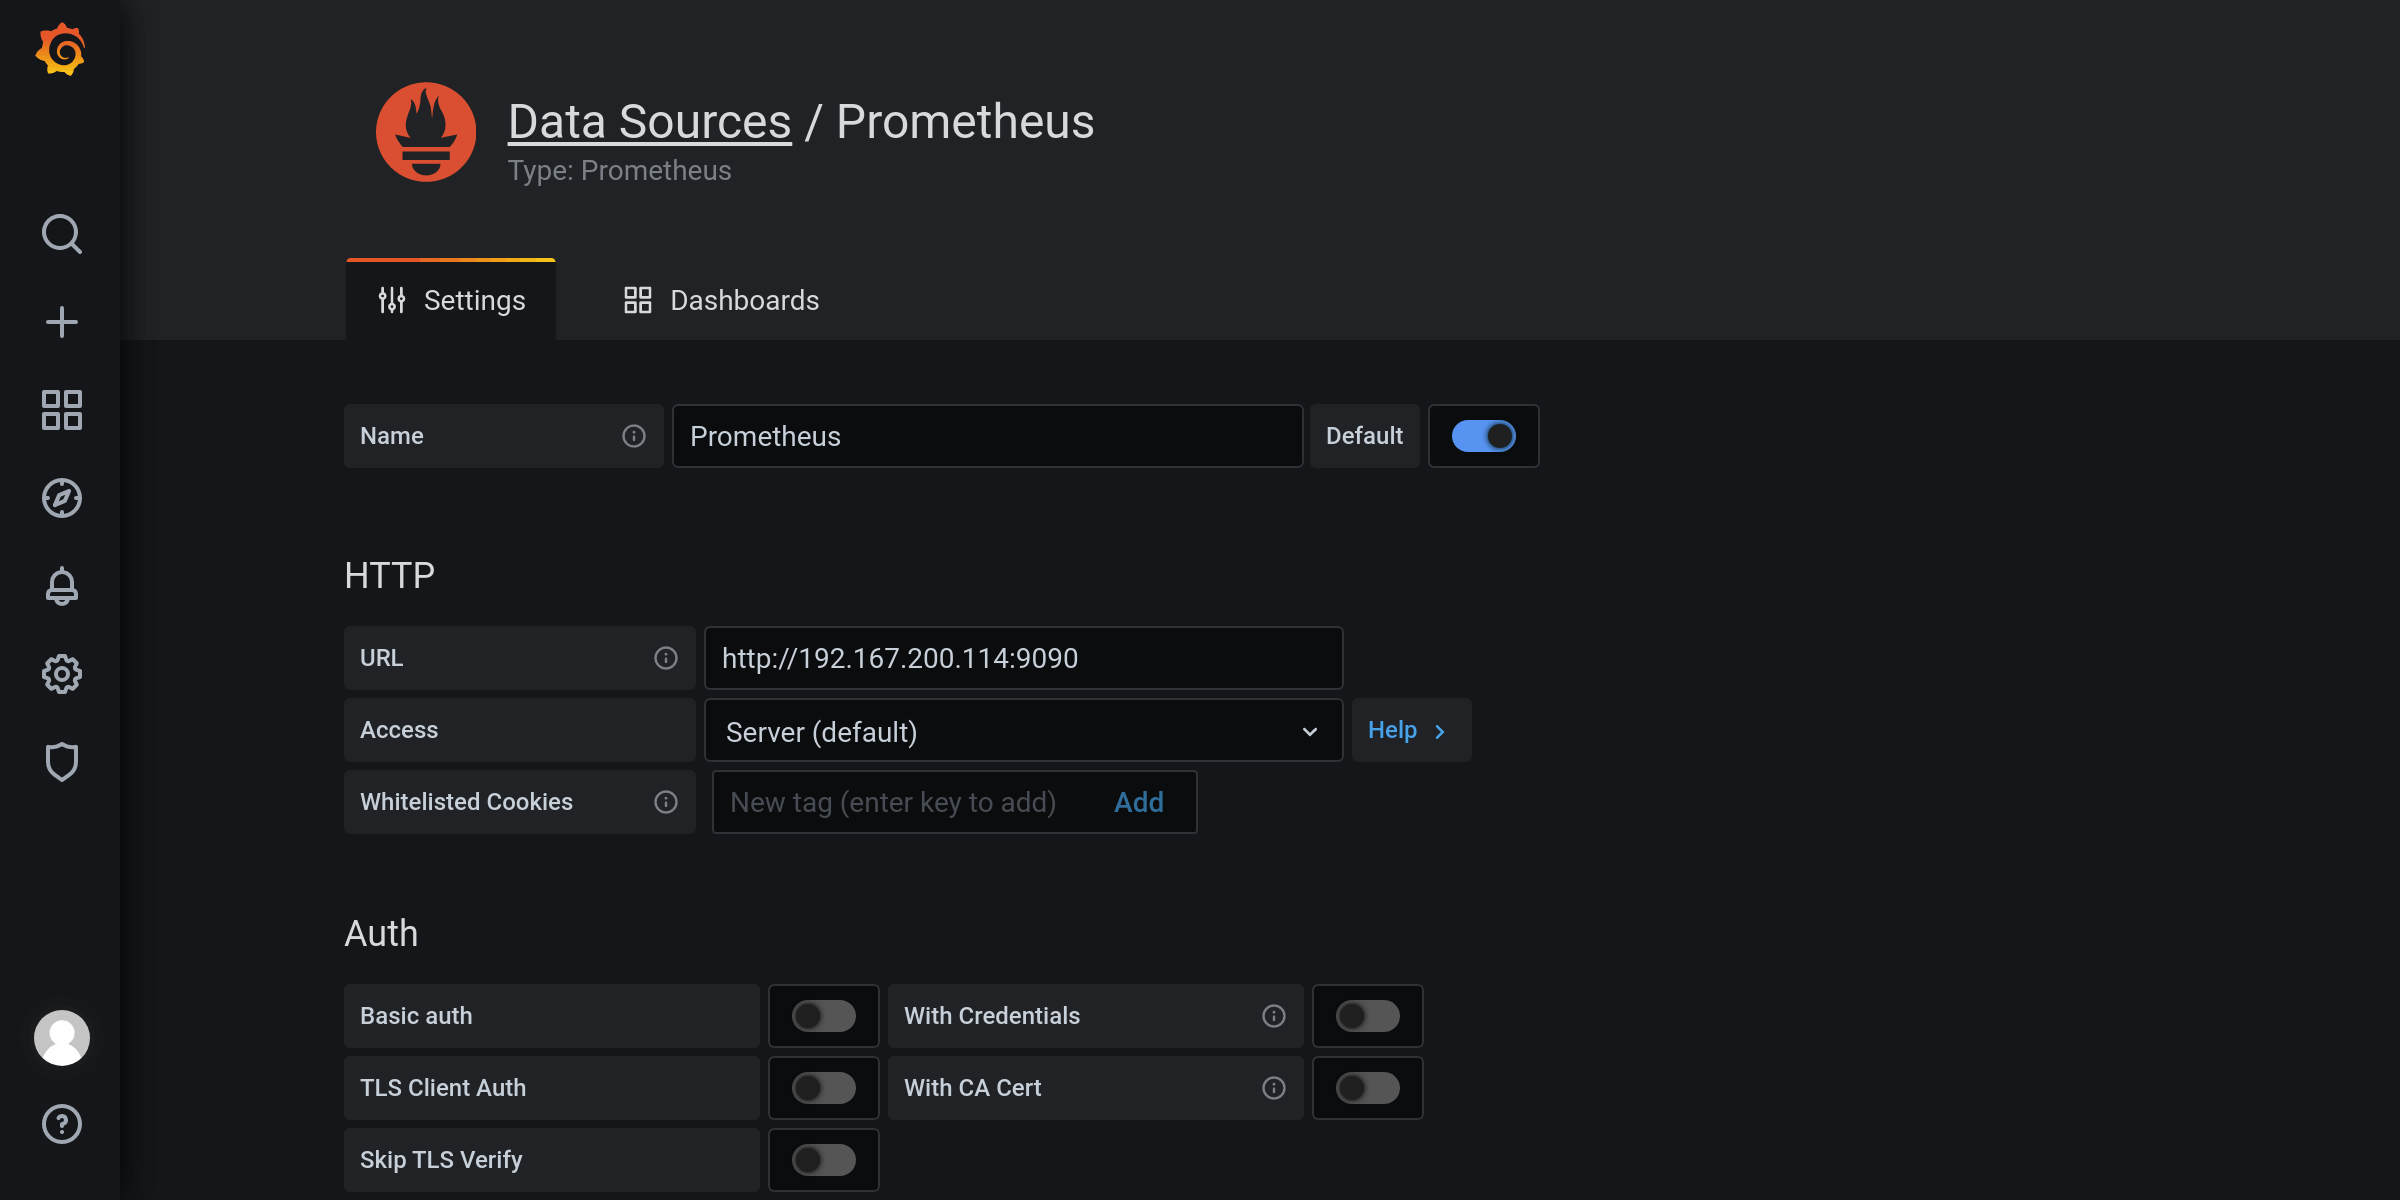
点击 Save & Test:
导入仪表盘
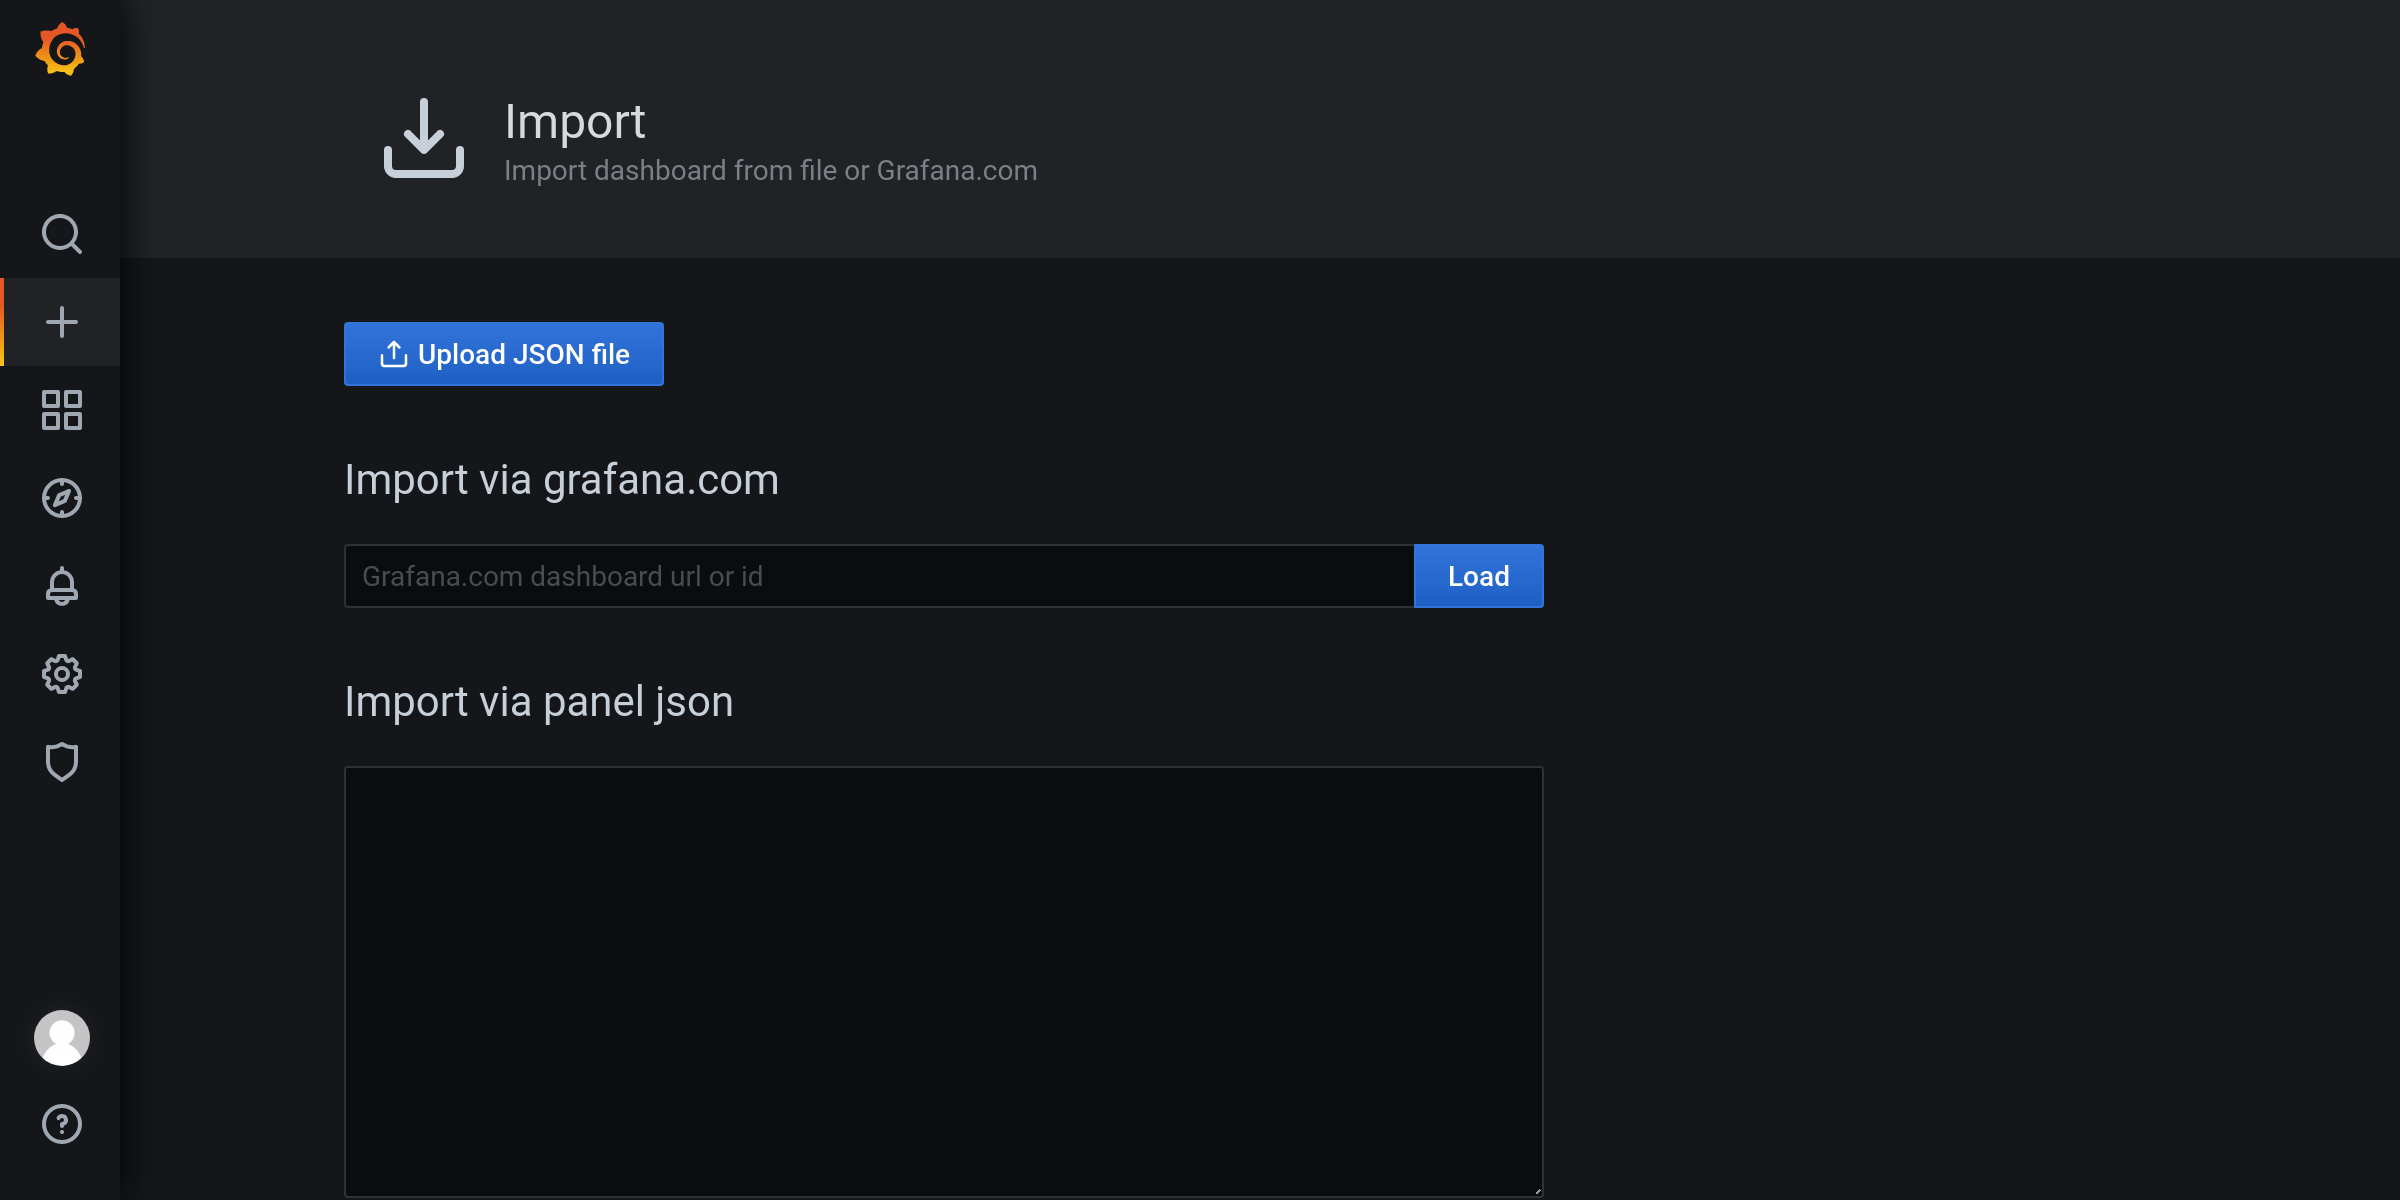
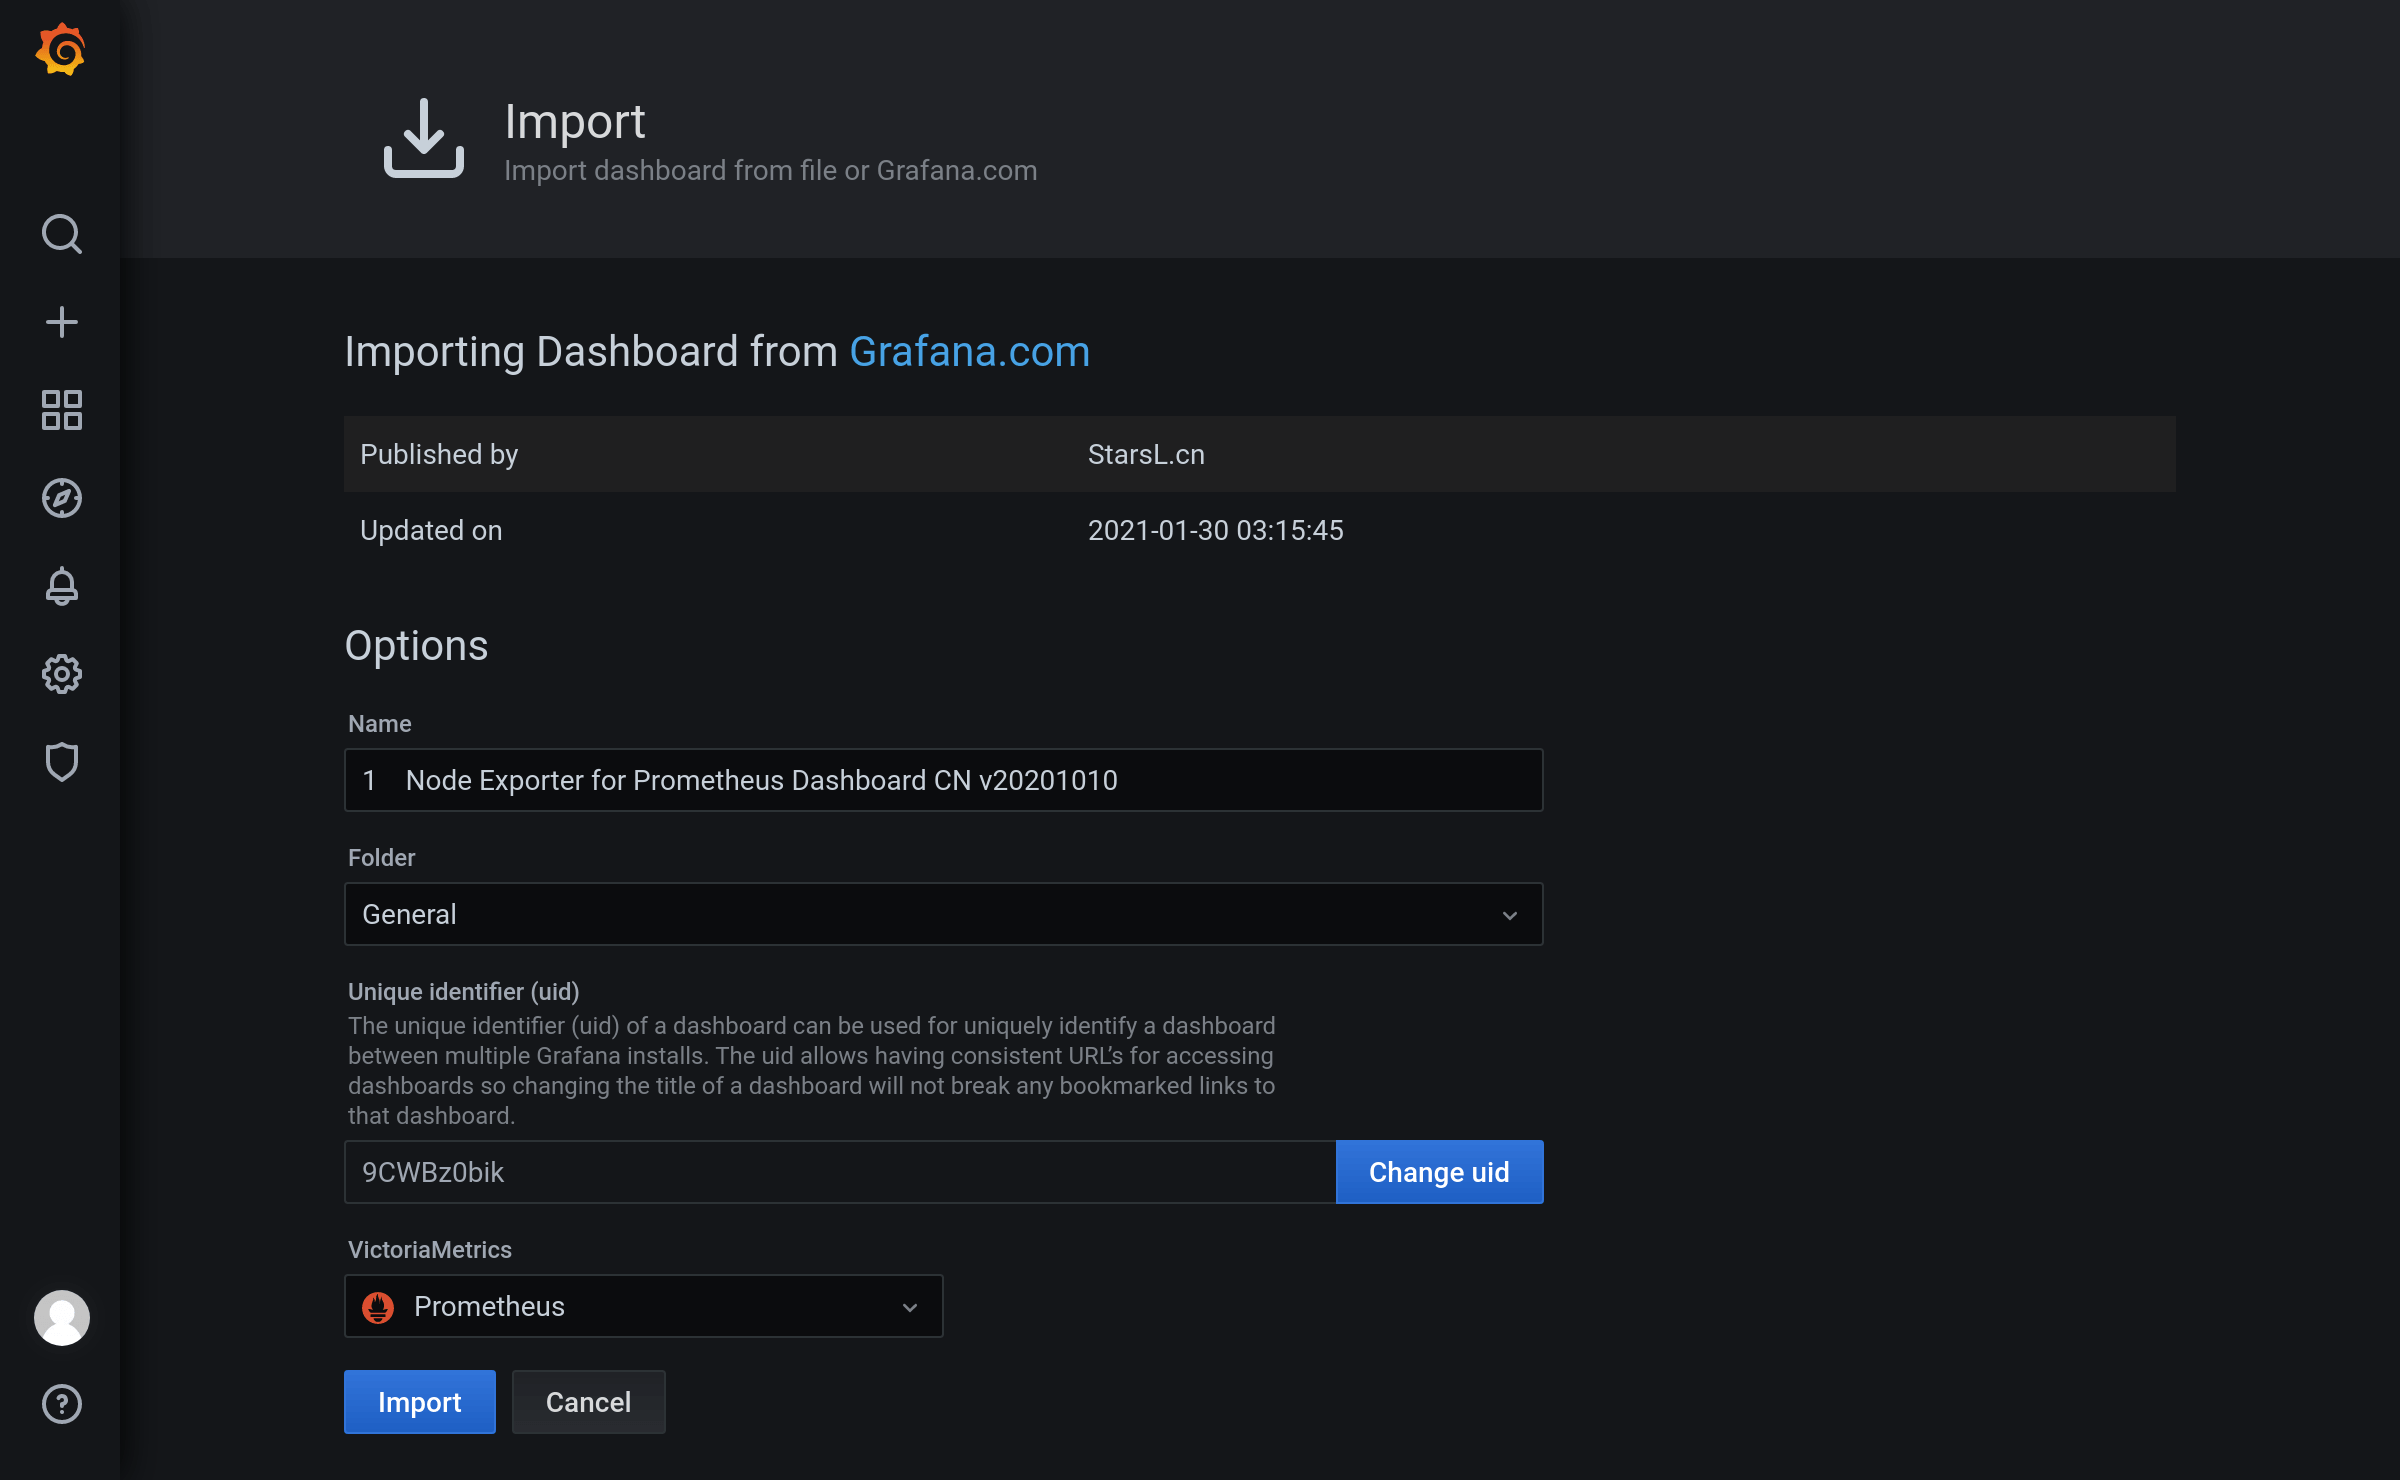
导入 8919 Node Exporter for Prometheus Dashboard by StarsL.cn:
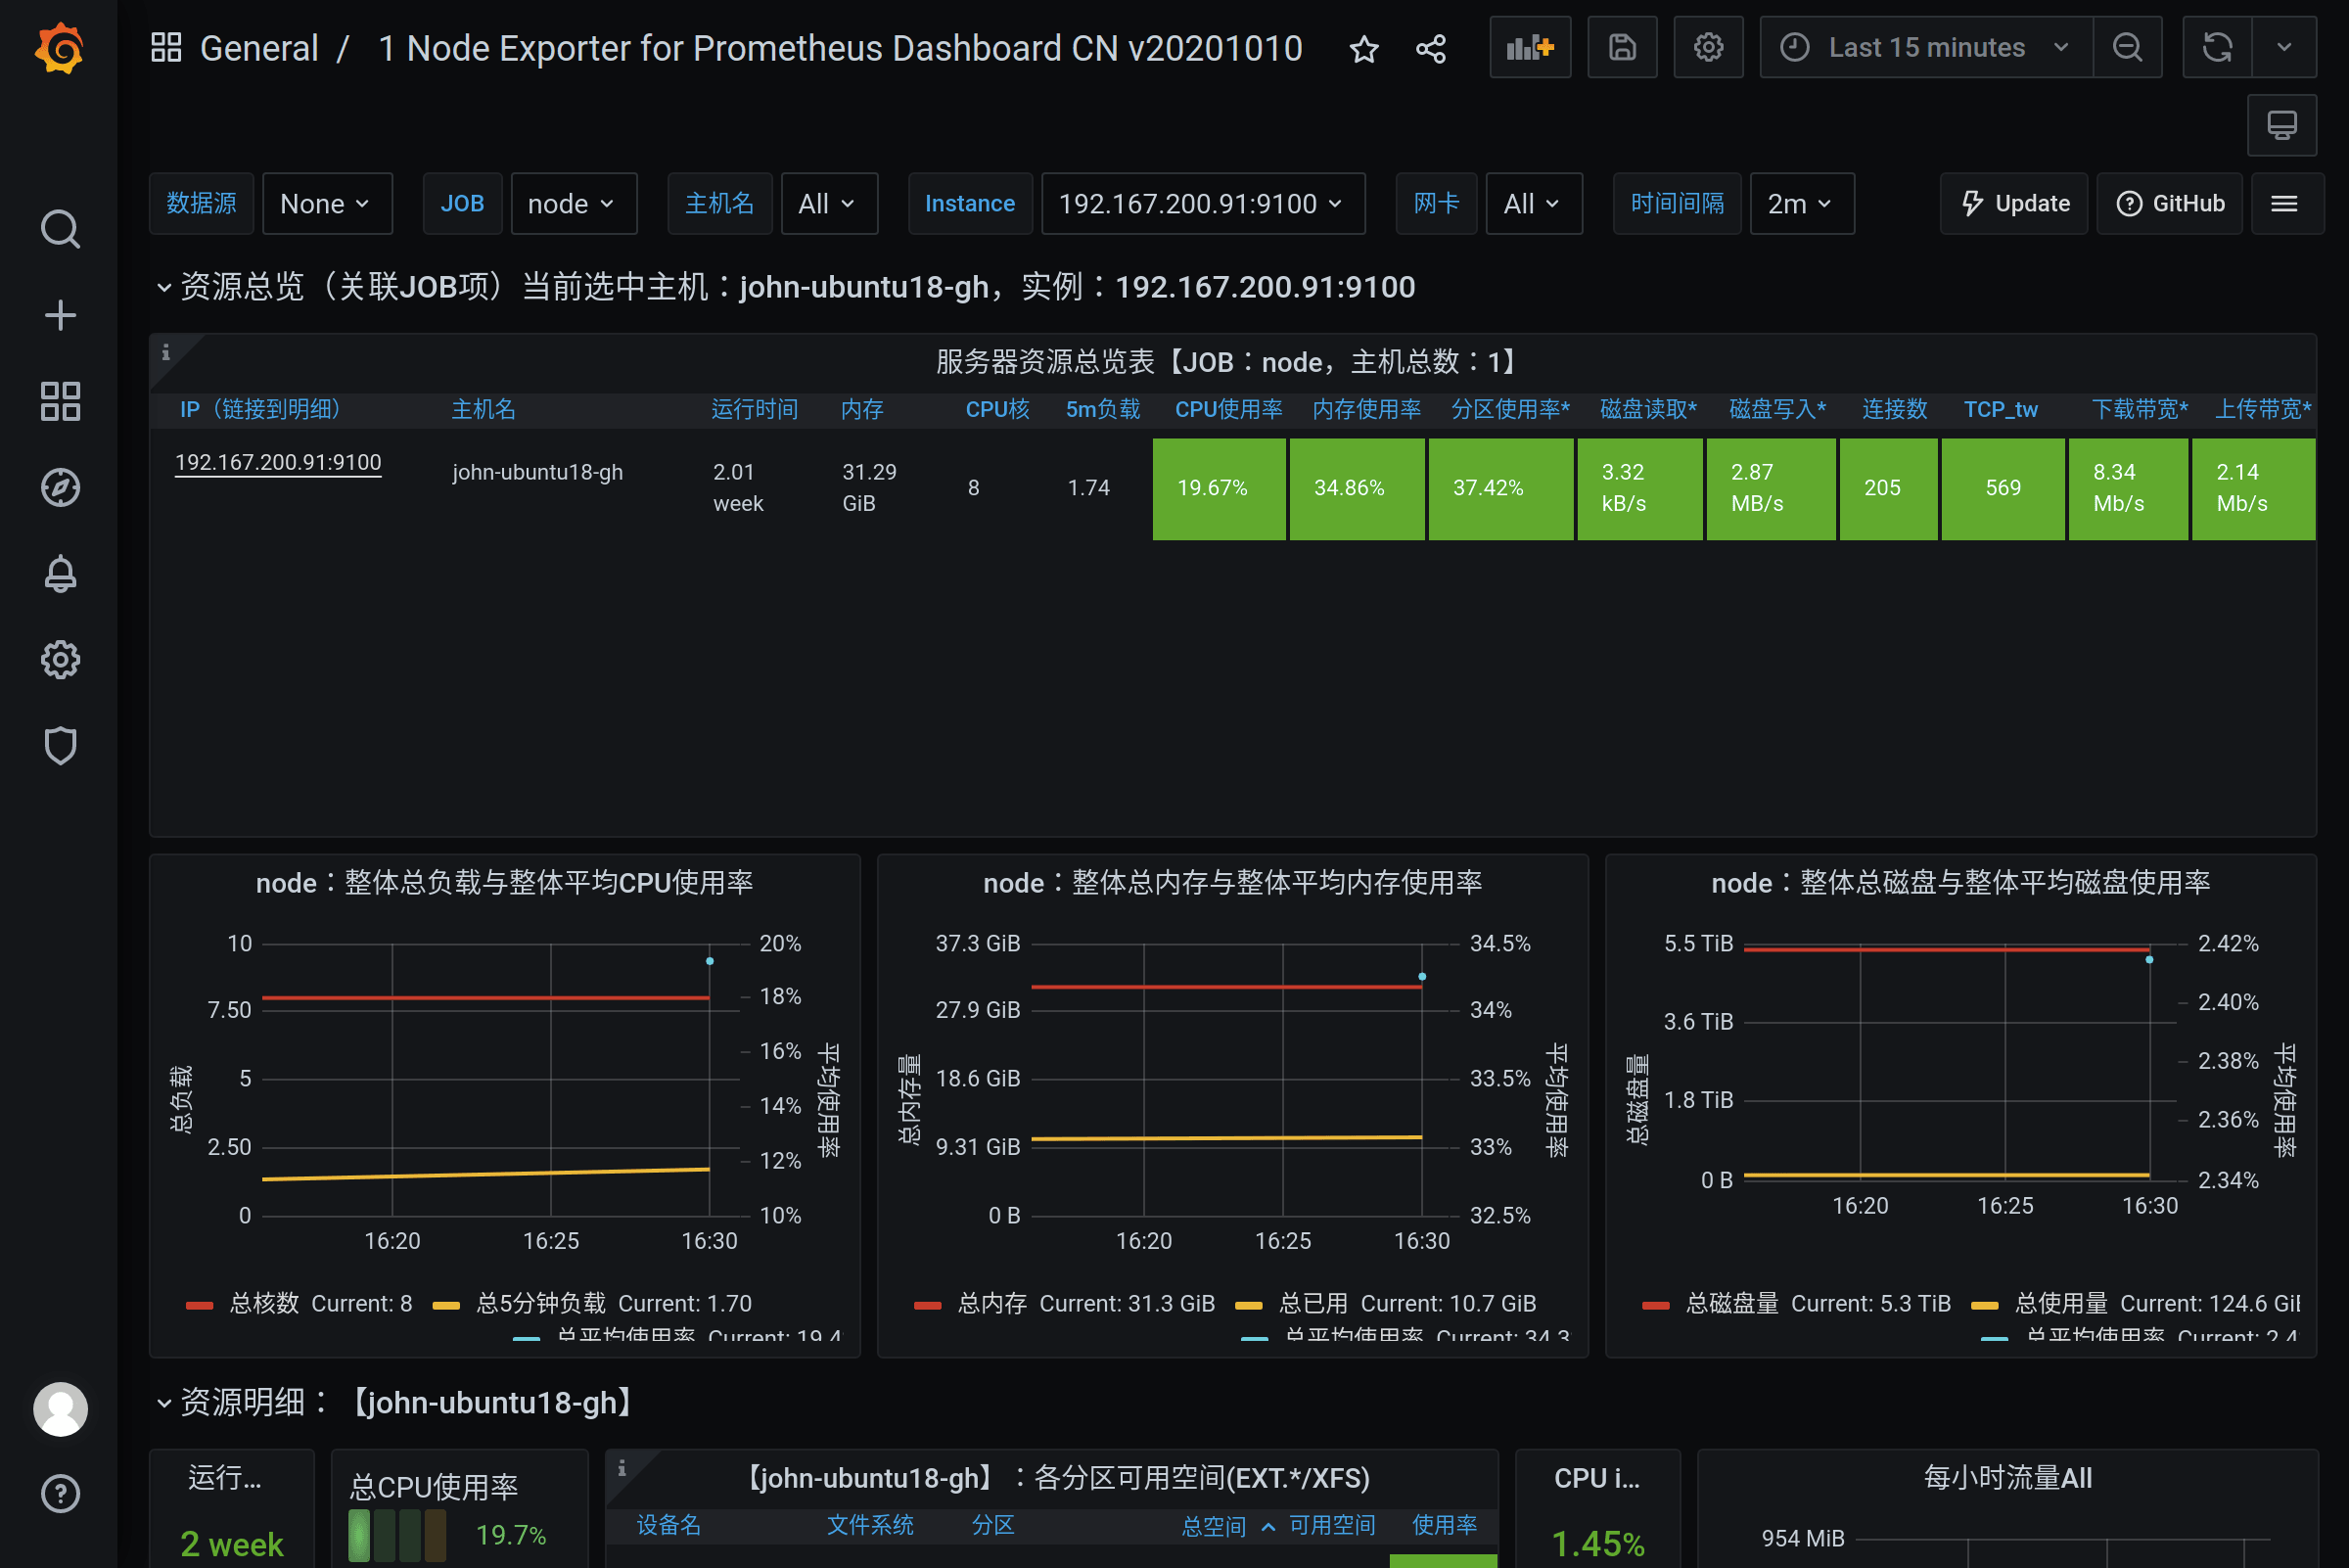
查看仪表盘:
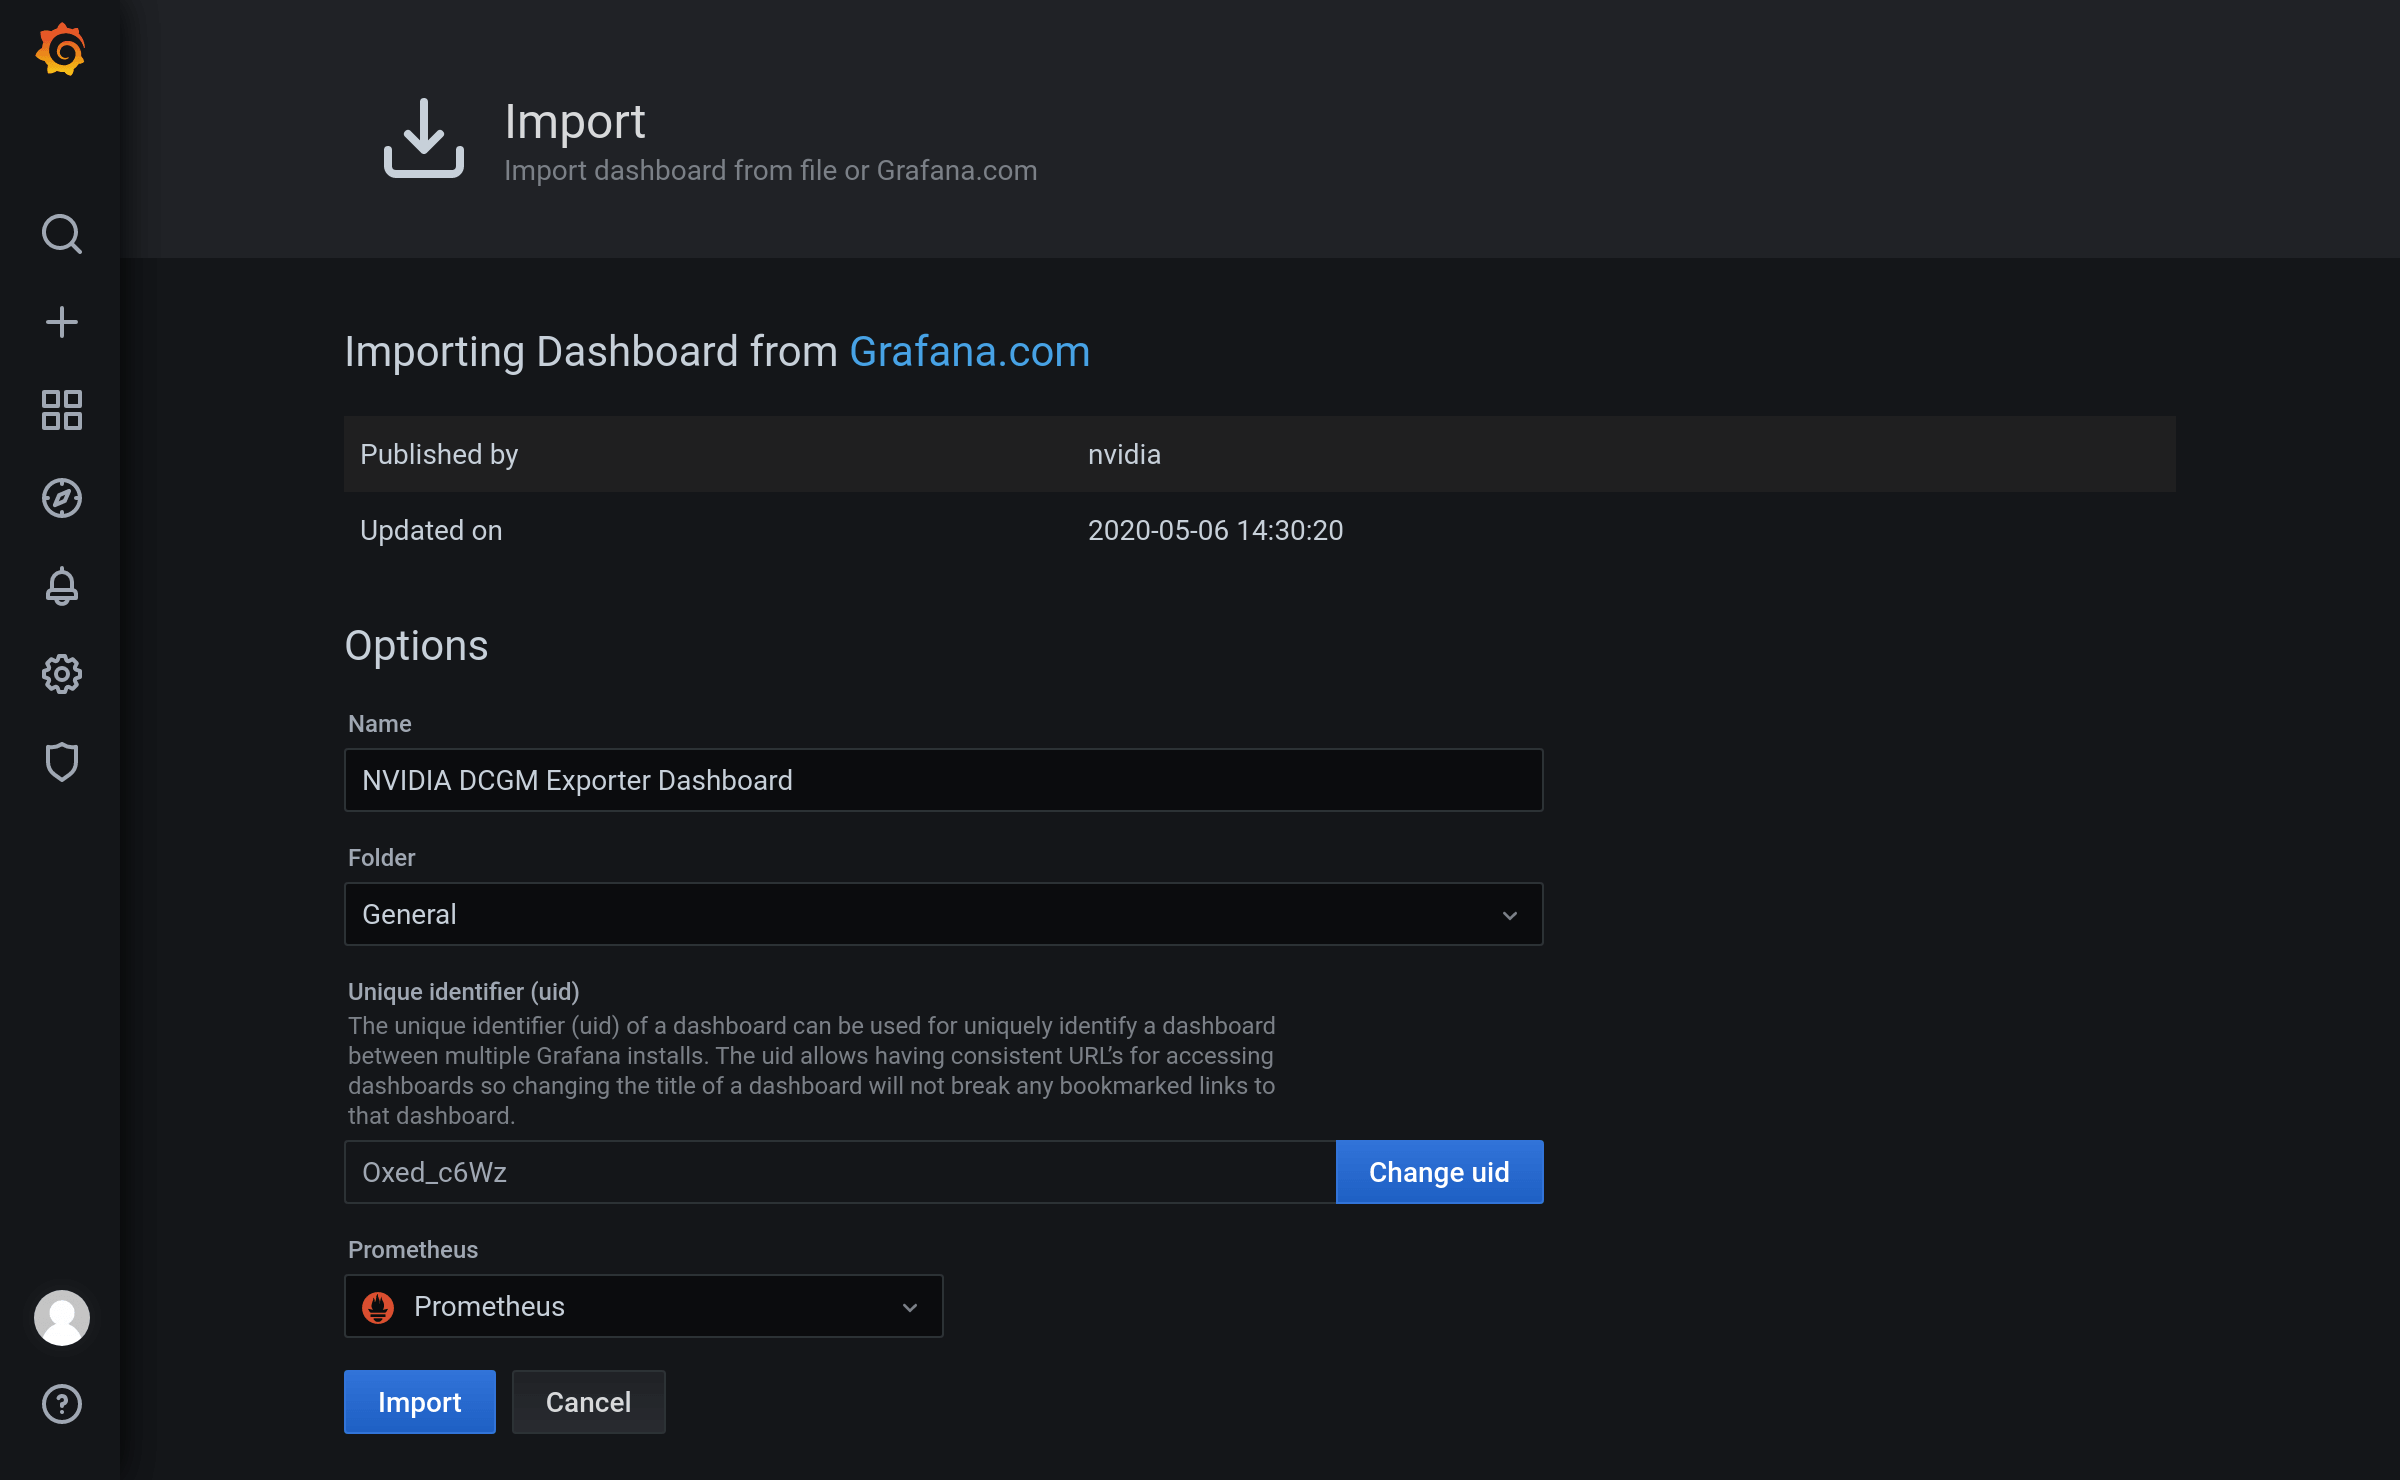
导入 12239 NVIDIA DCGM Exporter Dashboard by nvidia:
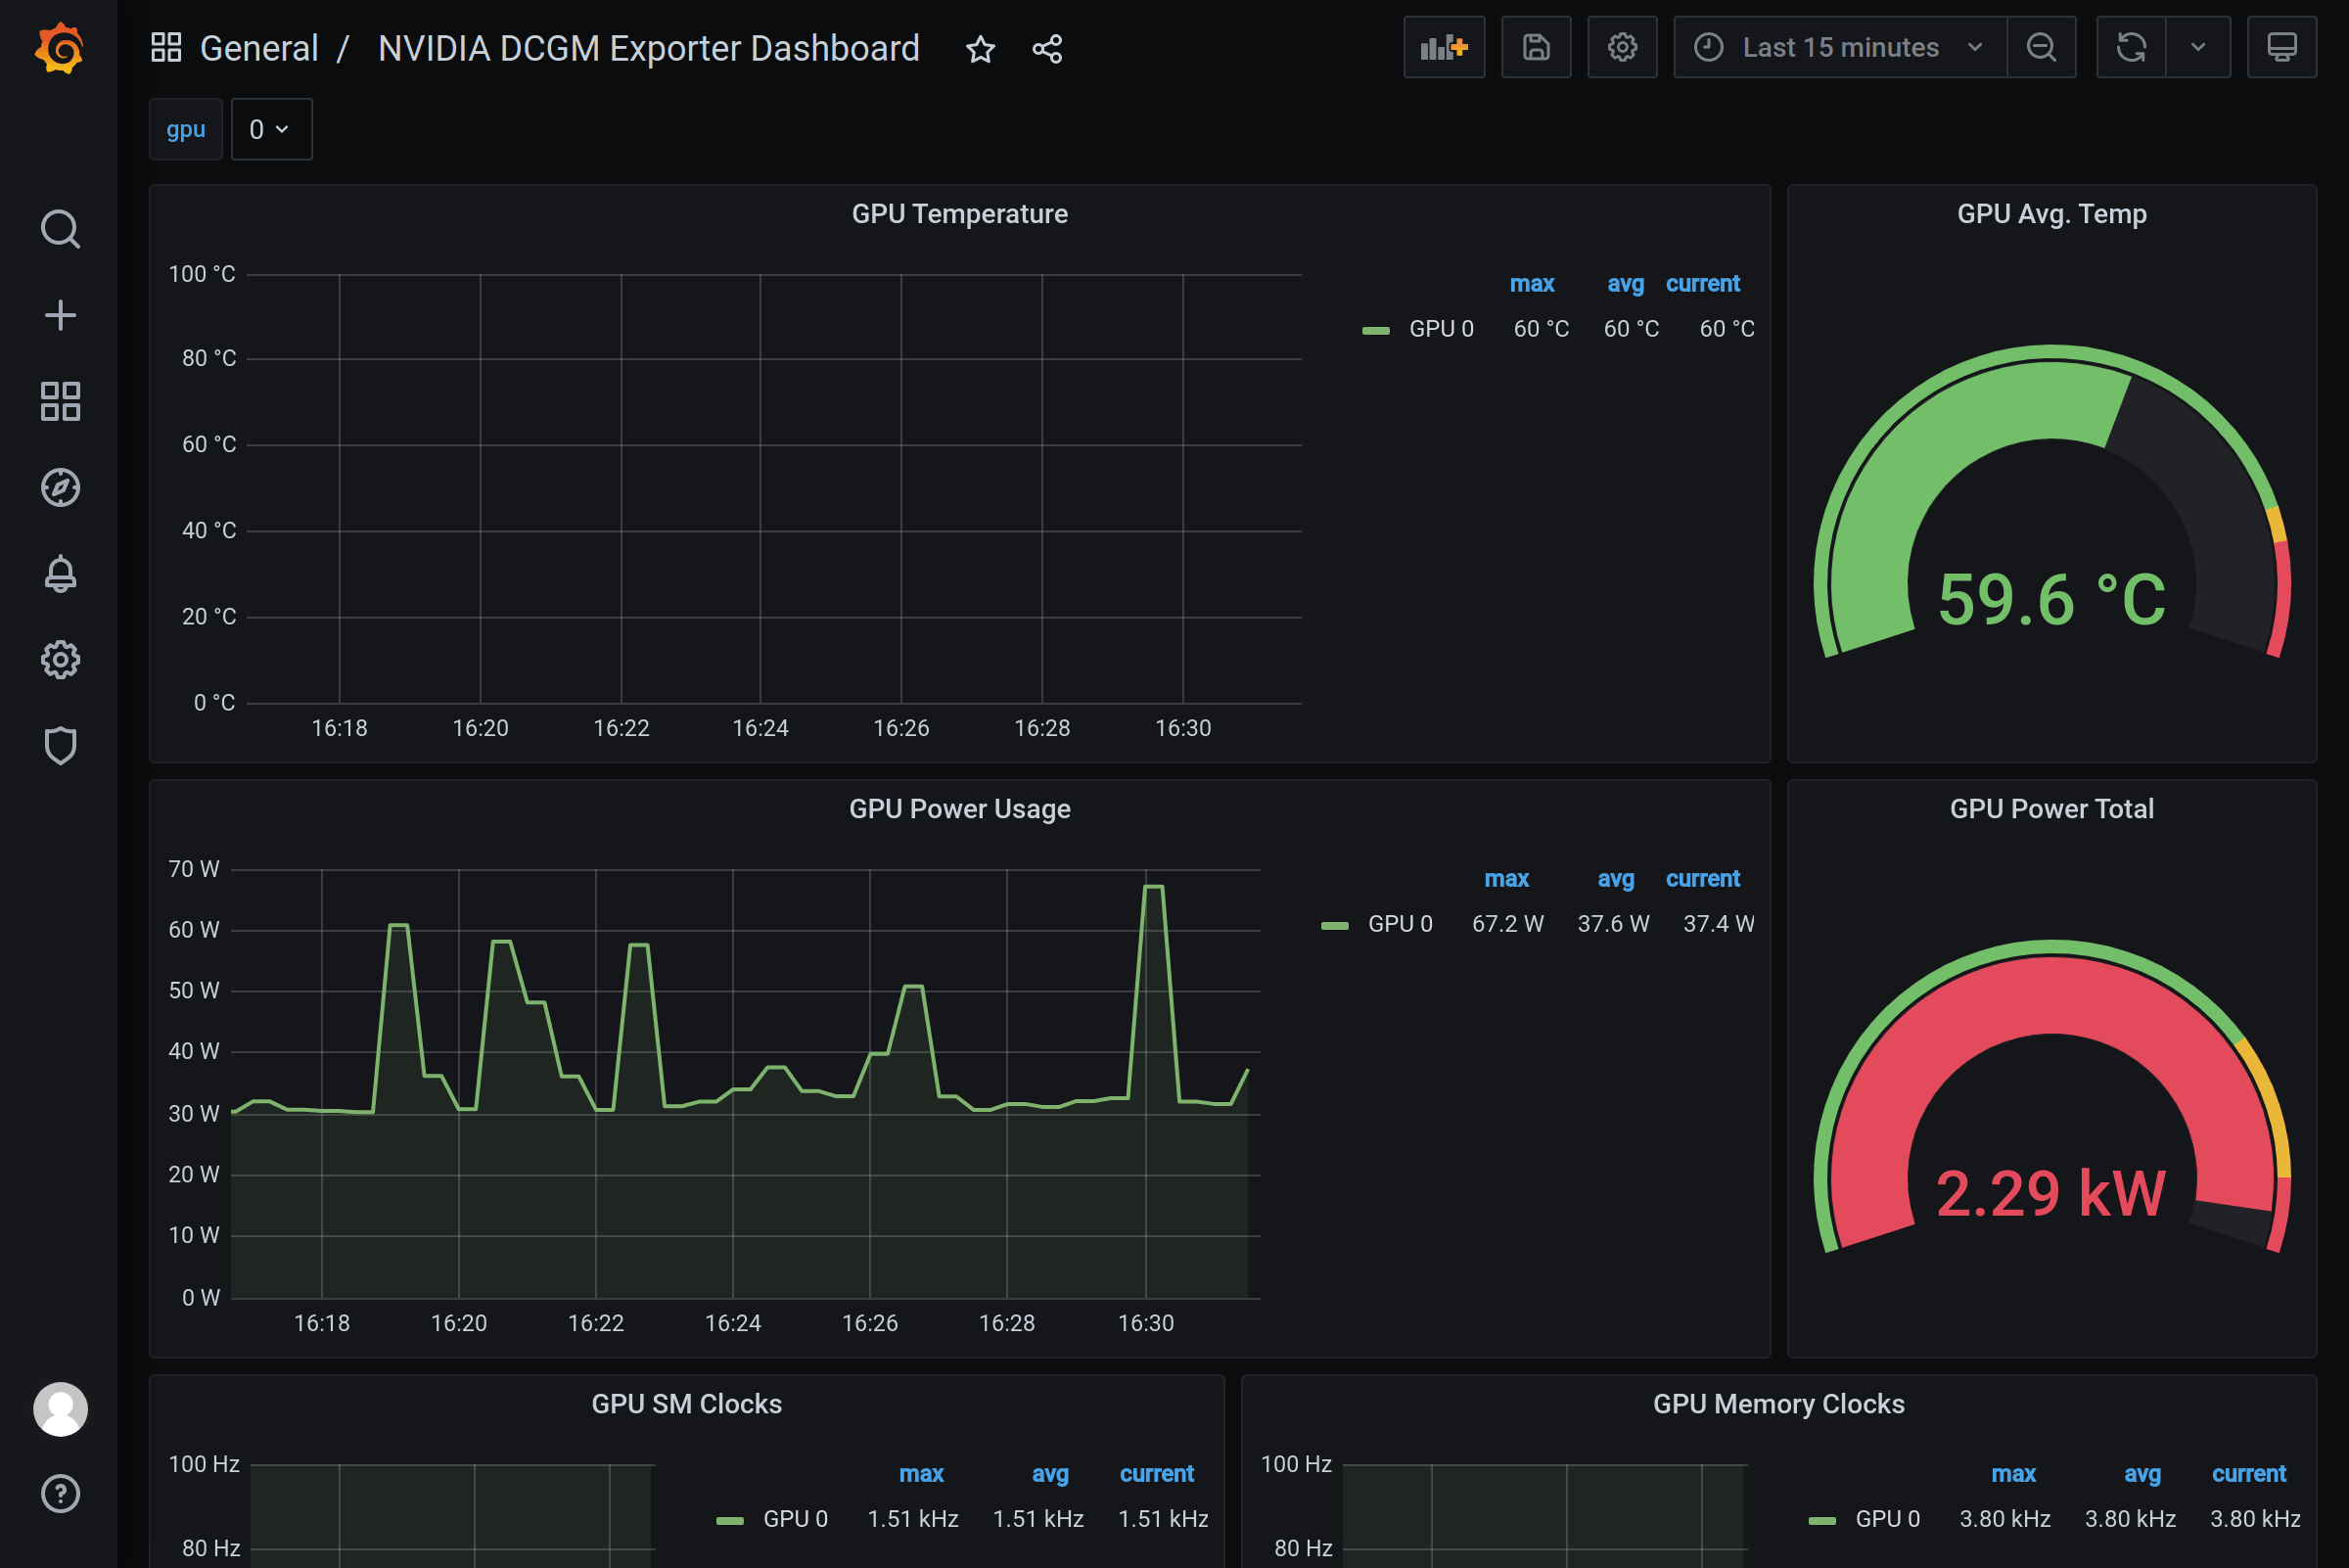
查看仪表盘: